

Hello and welcome back to another free article from RealPars, the world's largest online learning platform for cutting-edge industrial technologies.
In today’s article, we are going to learn about Traces in CODESYS. This article shows you how to add Traces to an existing CODESYS application.
If you are interested in learning how to develop CODESYS applications, then check out our course CODESYS 1: Introduction to PLC Programming which shows you how to write and test your first application with CODESYS.
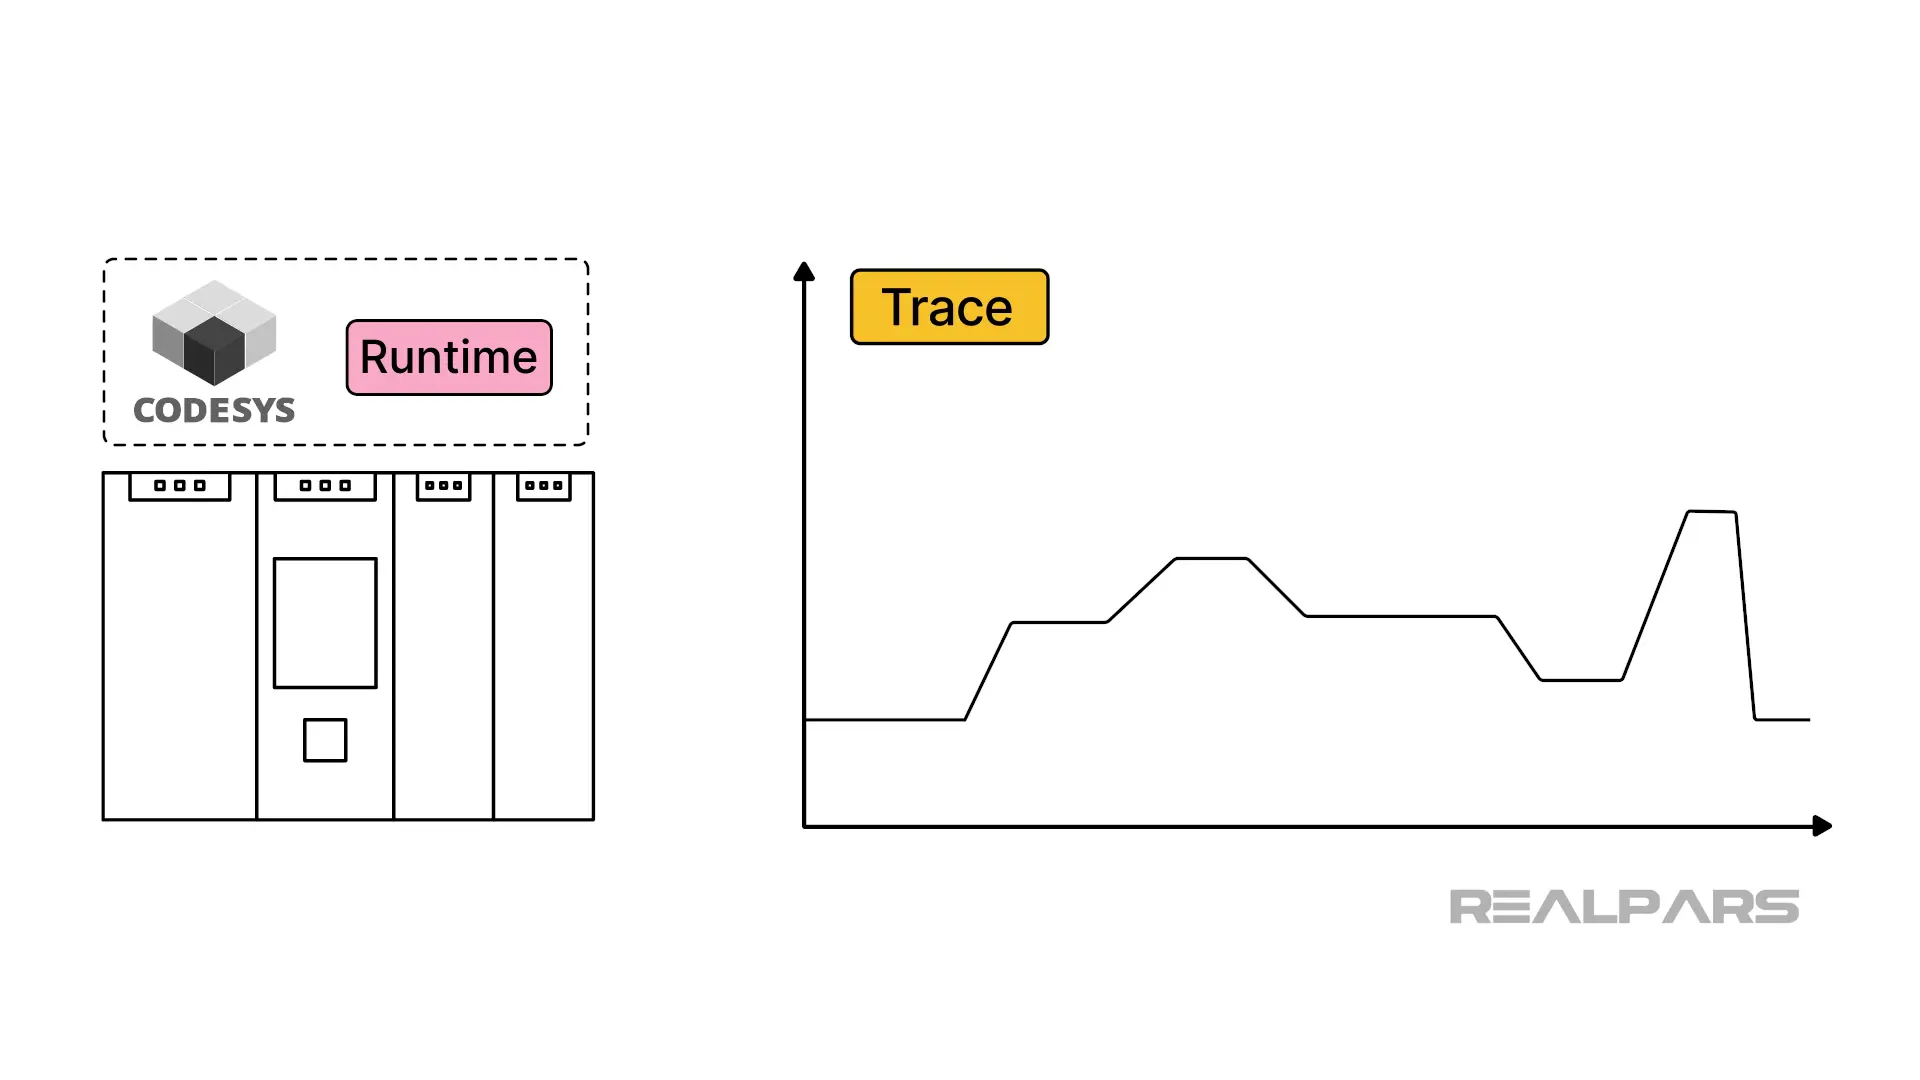
Traces are powerful debugging tools that let you create a graph of the values of application variables over time.
Traces are particularly useful for understanding what is happening in production systems that cannot be stopped, systems with real-time feedback like PID loops, and high-speed systems like labeling machines.
Let’s start by talking about how traces work in CODESYS.
How does a trace work in CODESYS?
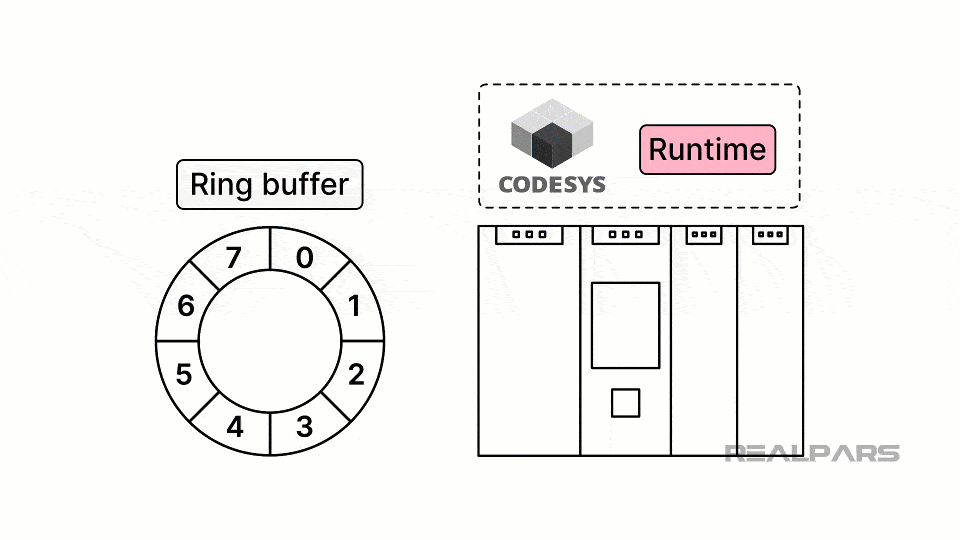
In CODESYS, a trace is an object that runs in the runtime on the PLC. While the trace is running, it records the values of a defined set of variables every PLC cycle.
The data captured by the trace is stored in a buffer with a fixed size in the PLC’s memory. Once the buffer is full, the oldest data in the buffer is overwritten by new data. This is what is called a ring buffer.
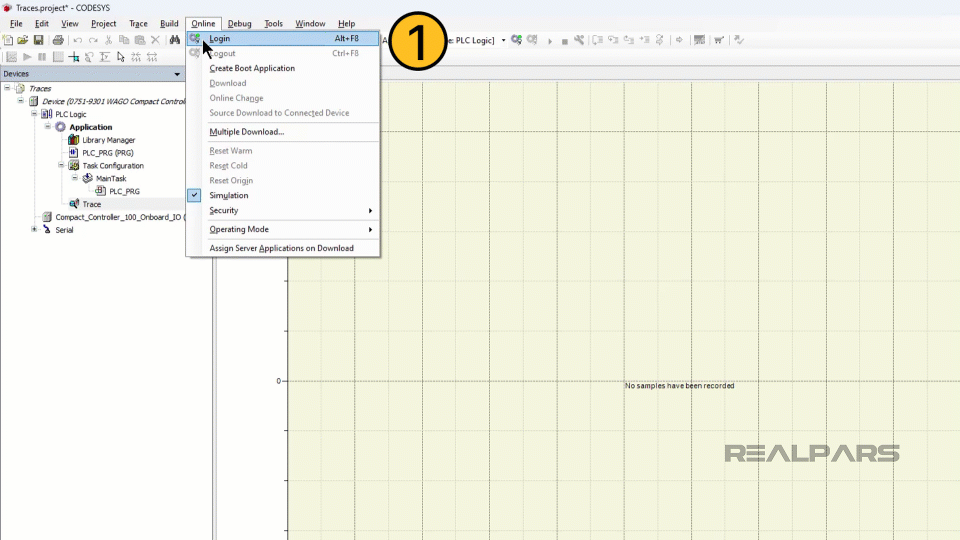
If you are logged in to the PLC through the CODESYS Development System, then you can monitor the trace’s data in real-time.
If you are not logged in to the PLC, the trace continues to collect data and this data can be uploaded to the CODESYS Development System for analysis later on.
Traces can be configured to have a trigger. When a trigger is detected, the trace records a pre-defined number of post-trigger samples and then stops recording data until the trigger is reset.
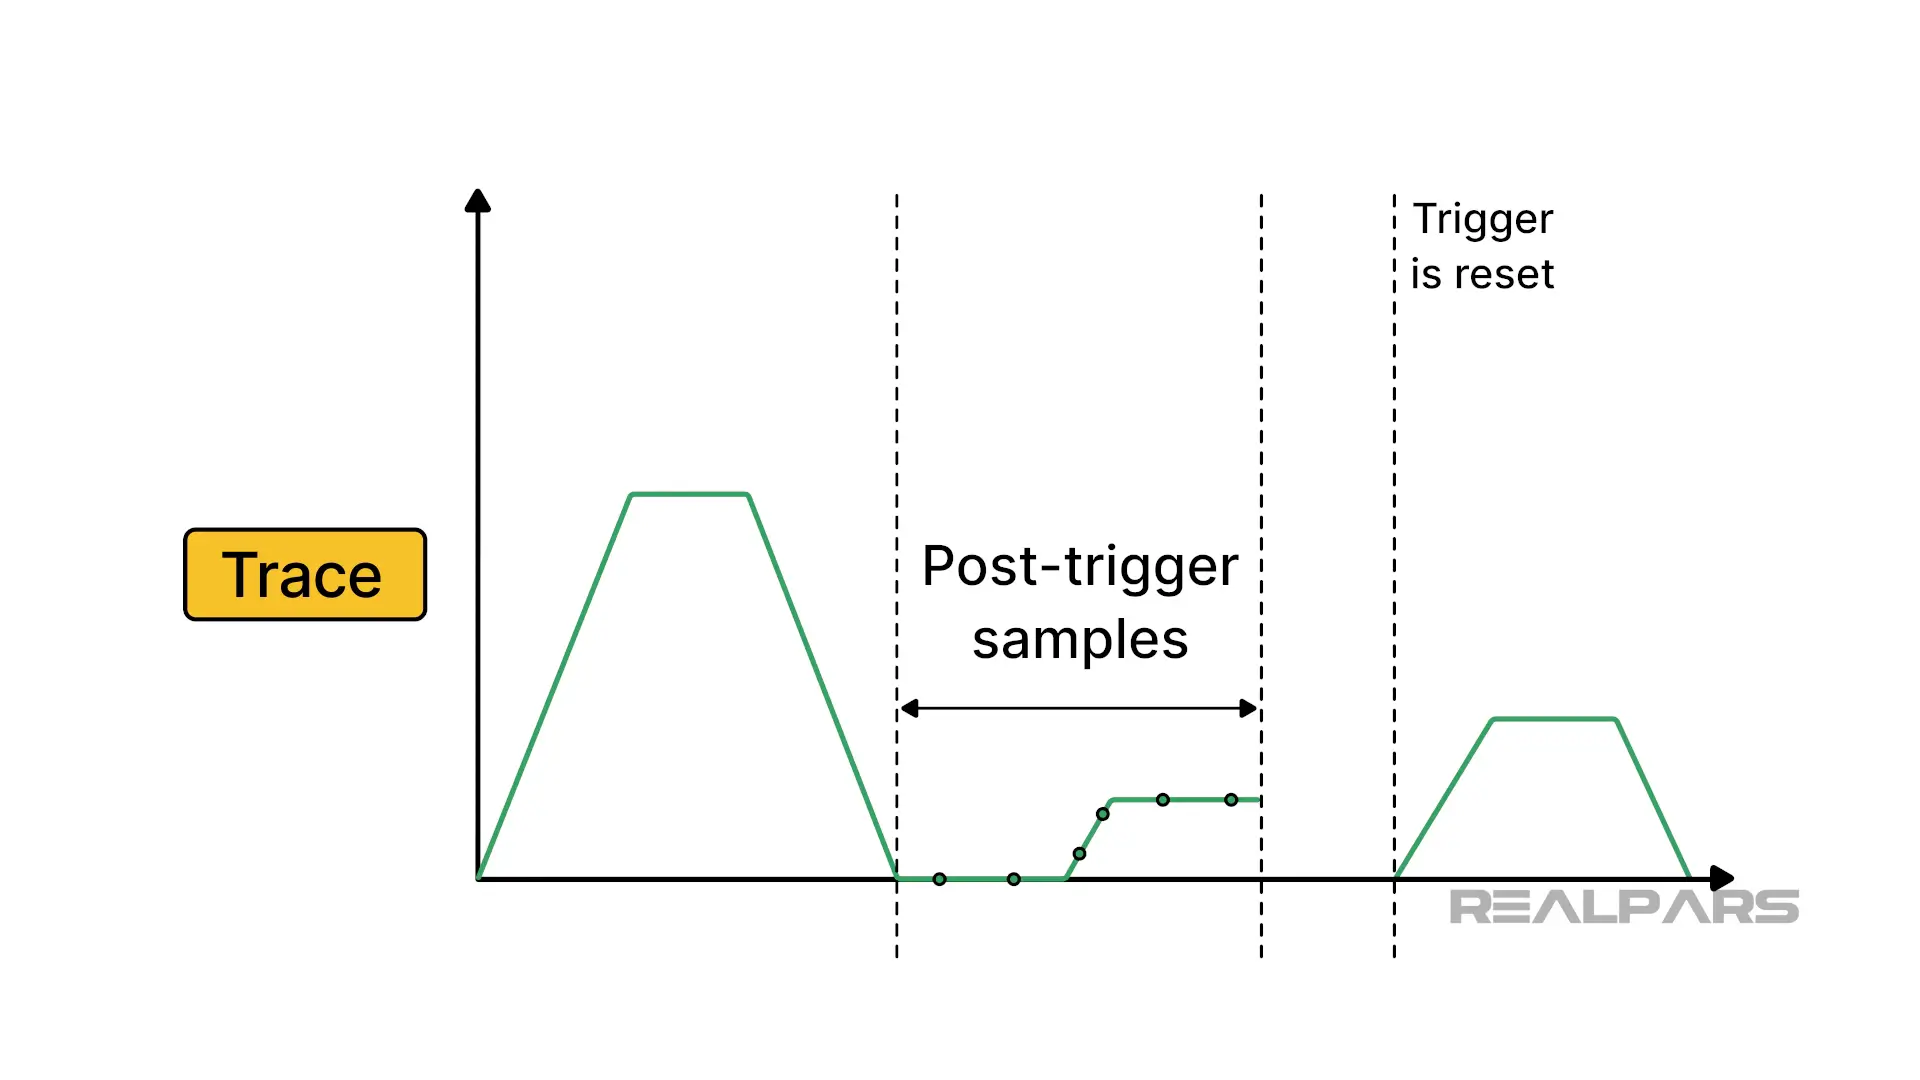
This is a very useful feature when you are trying to debug intermittent problems in a control system that are hard to monitor.
Now that we understand how traces work, let’s see how we can configure one in a CODESYS application.
Add a trace in CODESYS
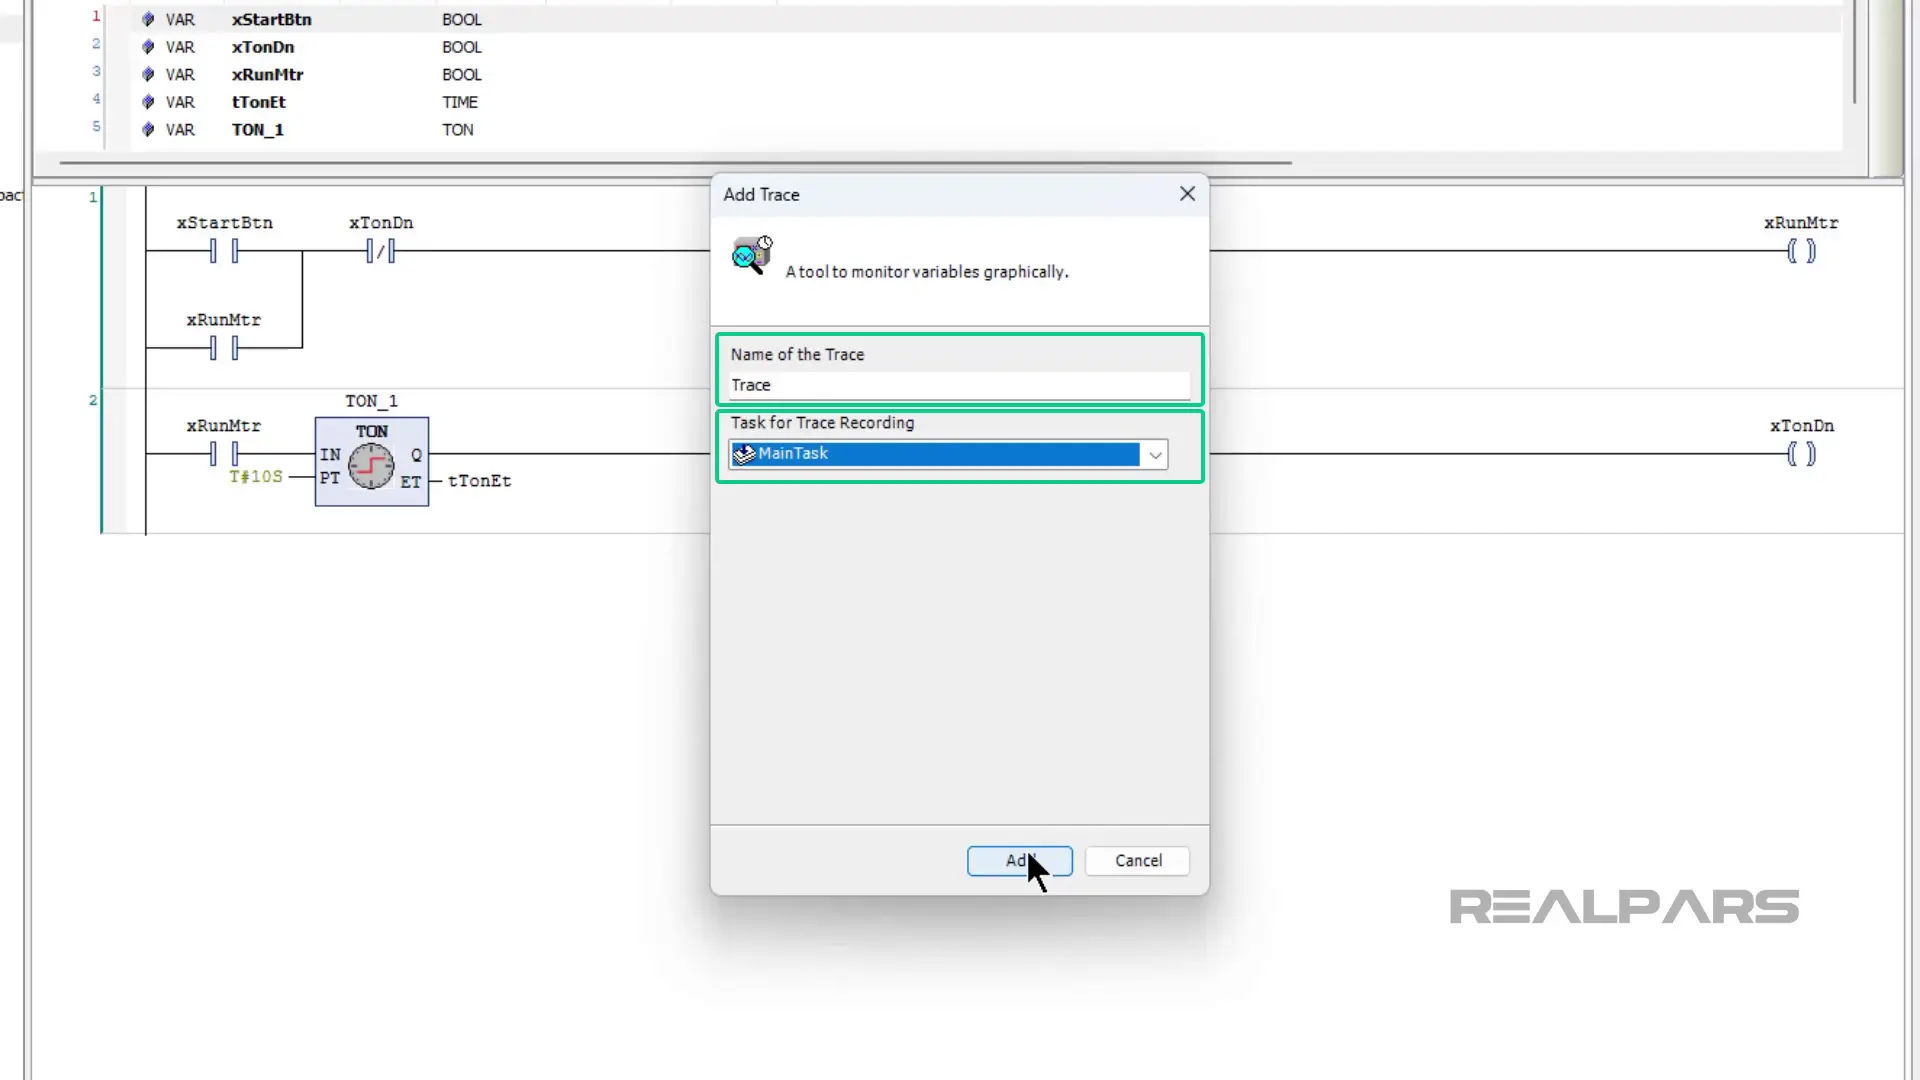
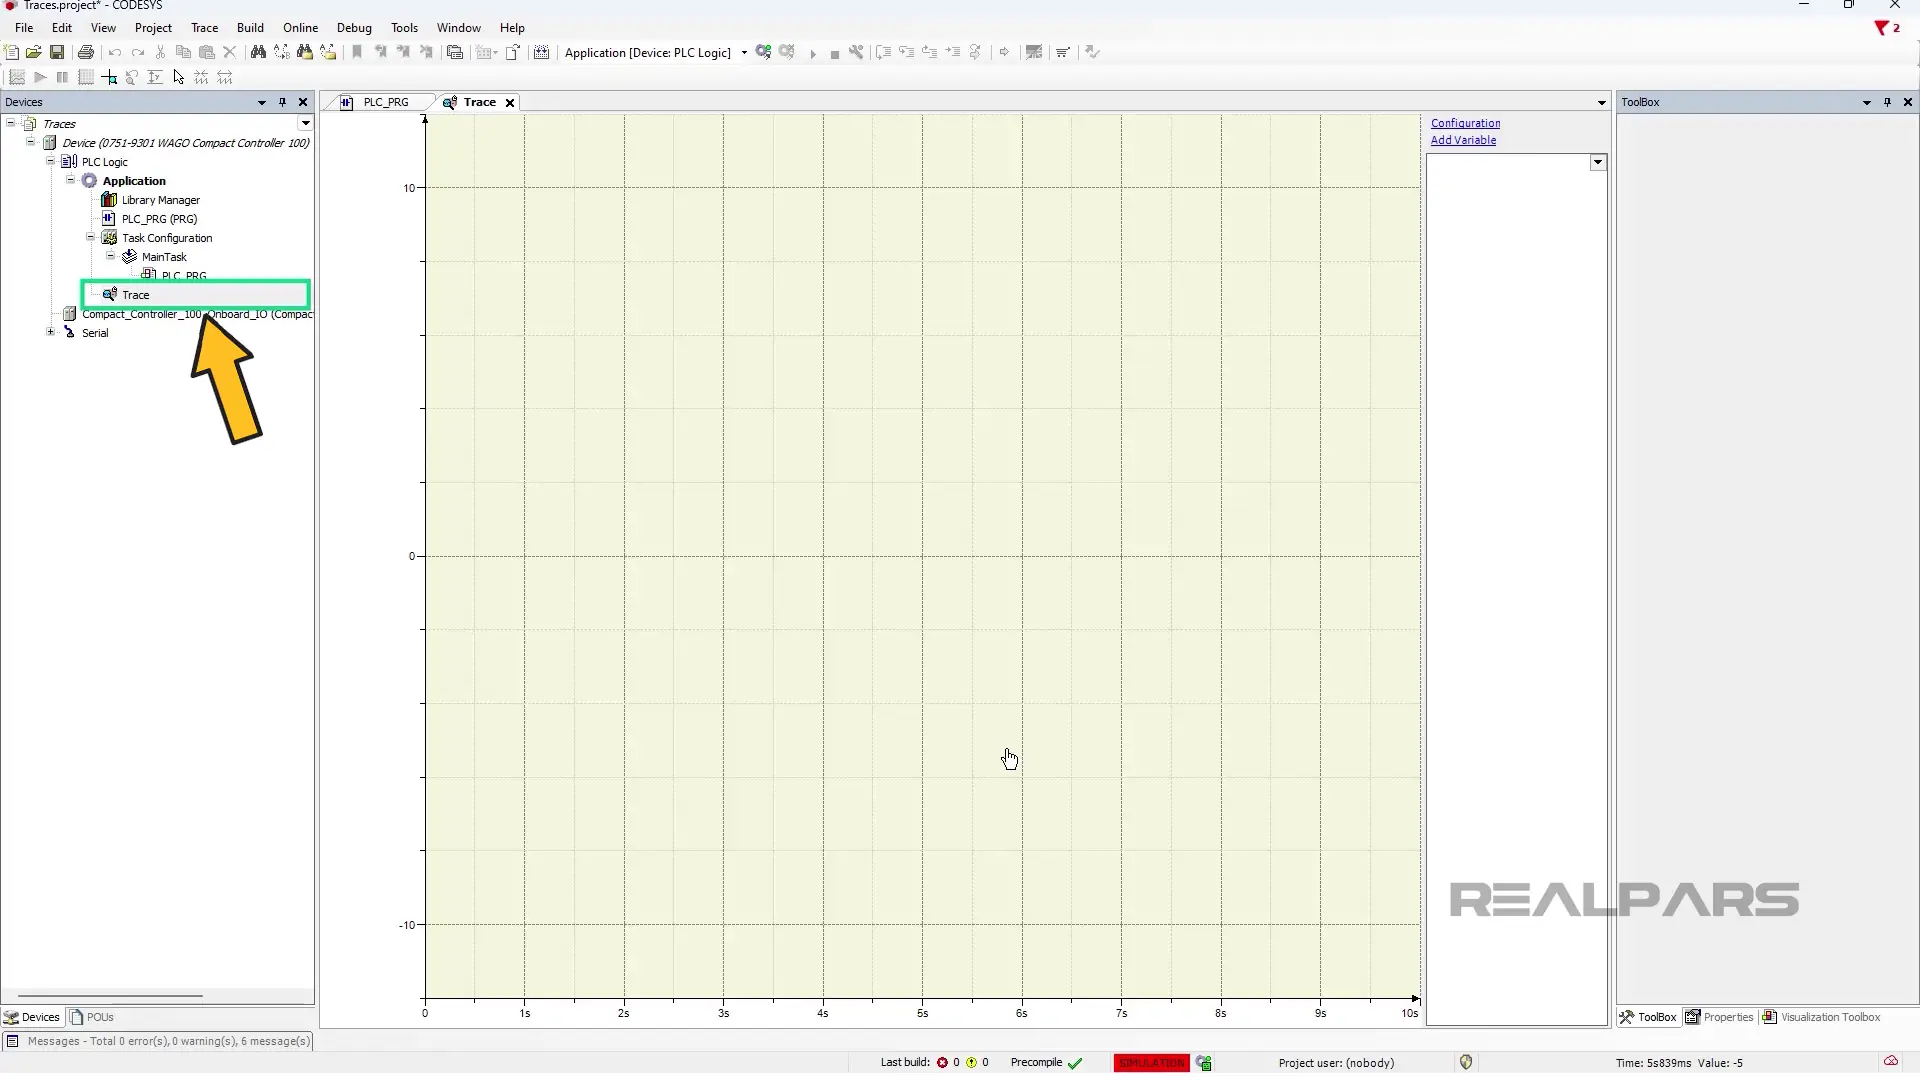
To add a trace to a CODESYS project, right-click on an application, select Add Object, and then Trace.

In the Add Trace dialog box, you can define the name of the trace and specify the task that is used for trace recording.
The task specified here is the task in which the trace will be run. A best practice is to specify the task where the variables being traced are written.
In this case, I will leave the default name in place and use the MainTask for trace recording.
After specifying the details of the trace, press Add to add the trace to the project.
In this example, we have added one trace to the application, but there is no limit to the number of traces that can be configured in a project.
Configure a trace
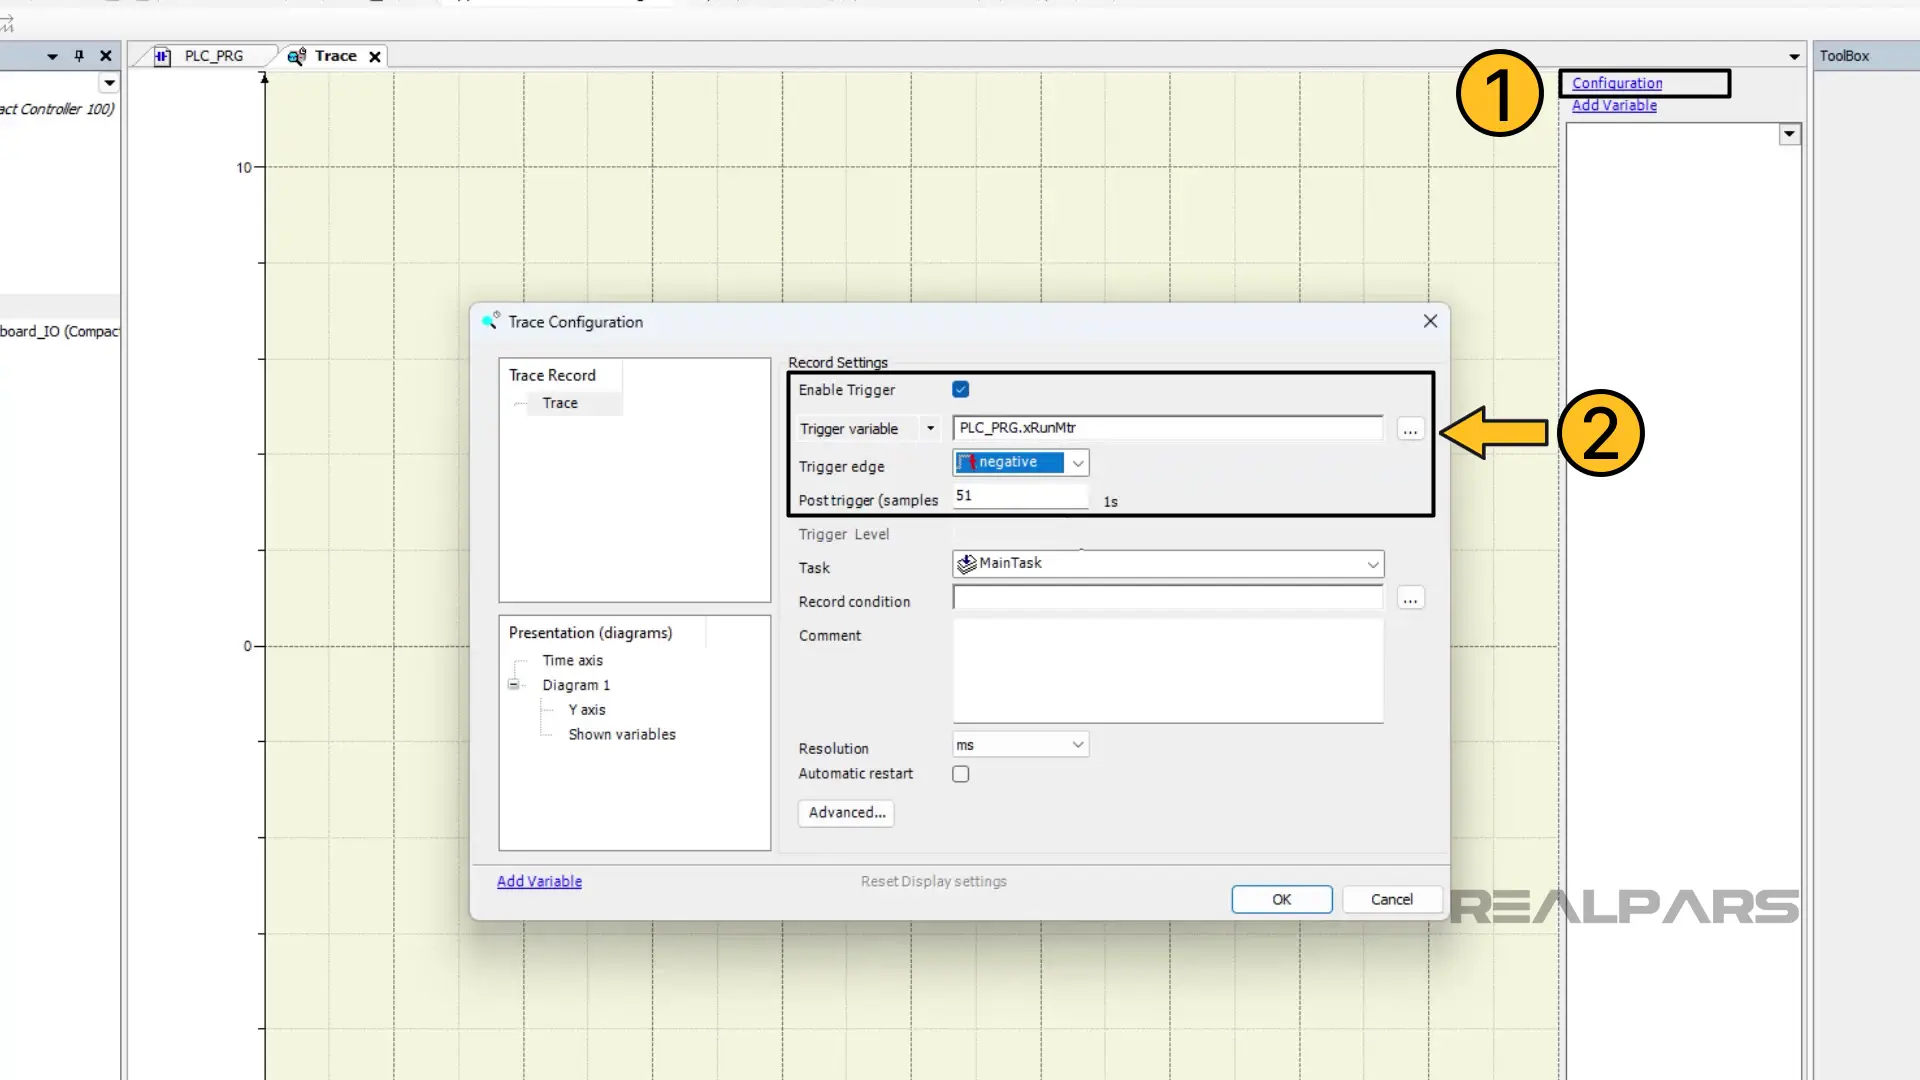
To configure a trace, click on the Configuration button in the top right corner of the trace.
In the Trace Configuration Dialog, you can configure a Trigger for the trace. If a trigger is not configured, then the trace will run continuously. In this example, we will configure a trigger for the trace.
To do that, check the Enable Trigger option and specify a trigger variable as shown here.
The trigger variable can be a numeric or Boolean variable and the positive or negative edge of the variable can be used to trigger the trace.
After configuring the trigger for the trace, you can specify the number of post-trigger samples to be recorded by the trace.
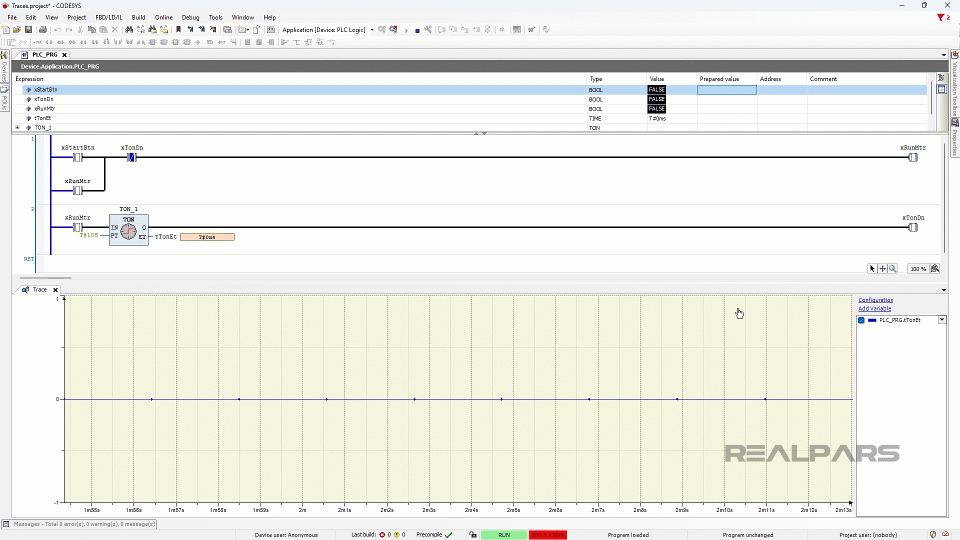
In this example, the trace is configured so that the trigger is activated when the variable xRunMtr becomes False. When that trigger is detected, the trace will record 51 samples or 1 second of data and then stop recording until the trace is manually reset.
By clicking the Advanced button, you can access the Advanced Trace Settings.
In these settings, you can specify the sample rate for the trace and the size of the ring buffer. In this example, I change the sample rate of the trace to every 100 PLC cycles and do not modify the runtime buffer size.
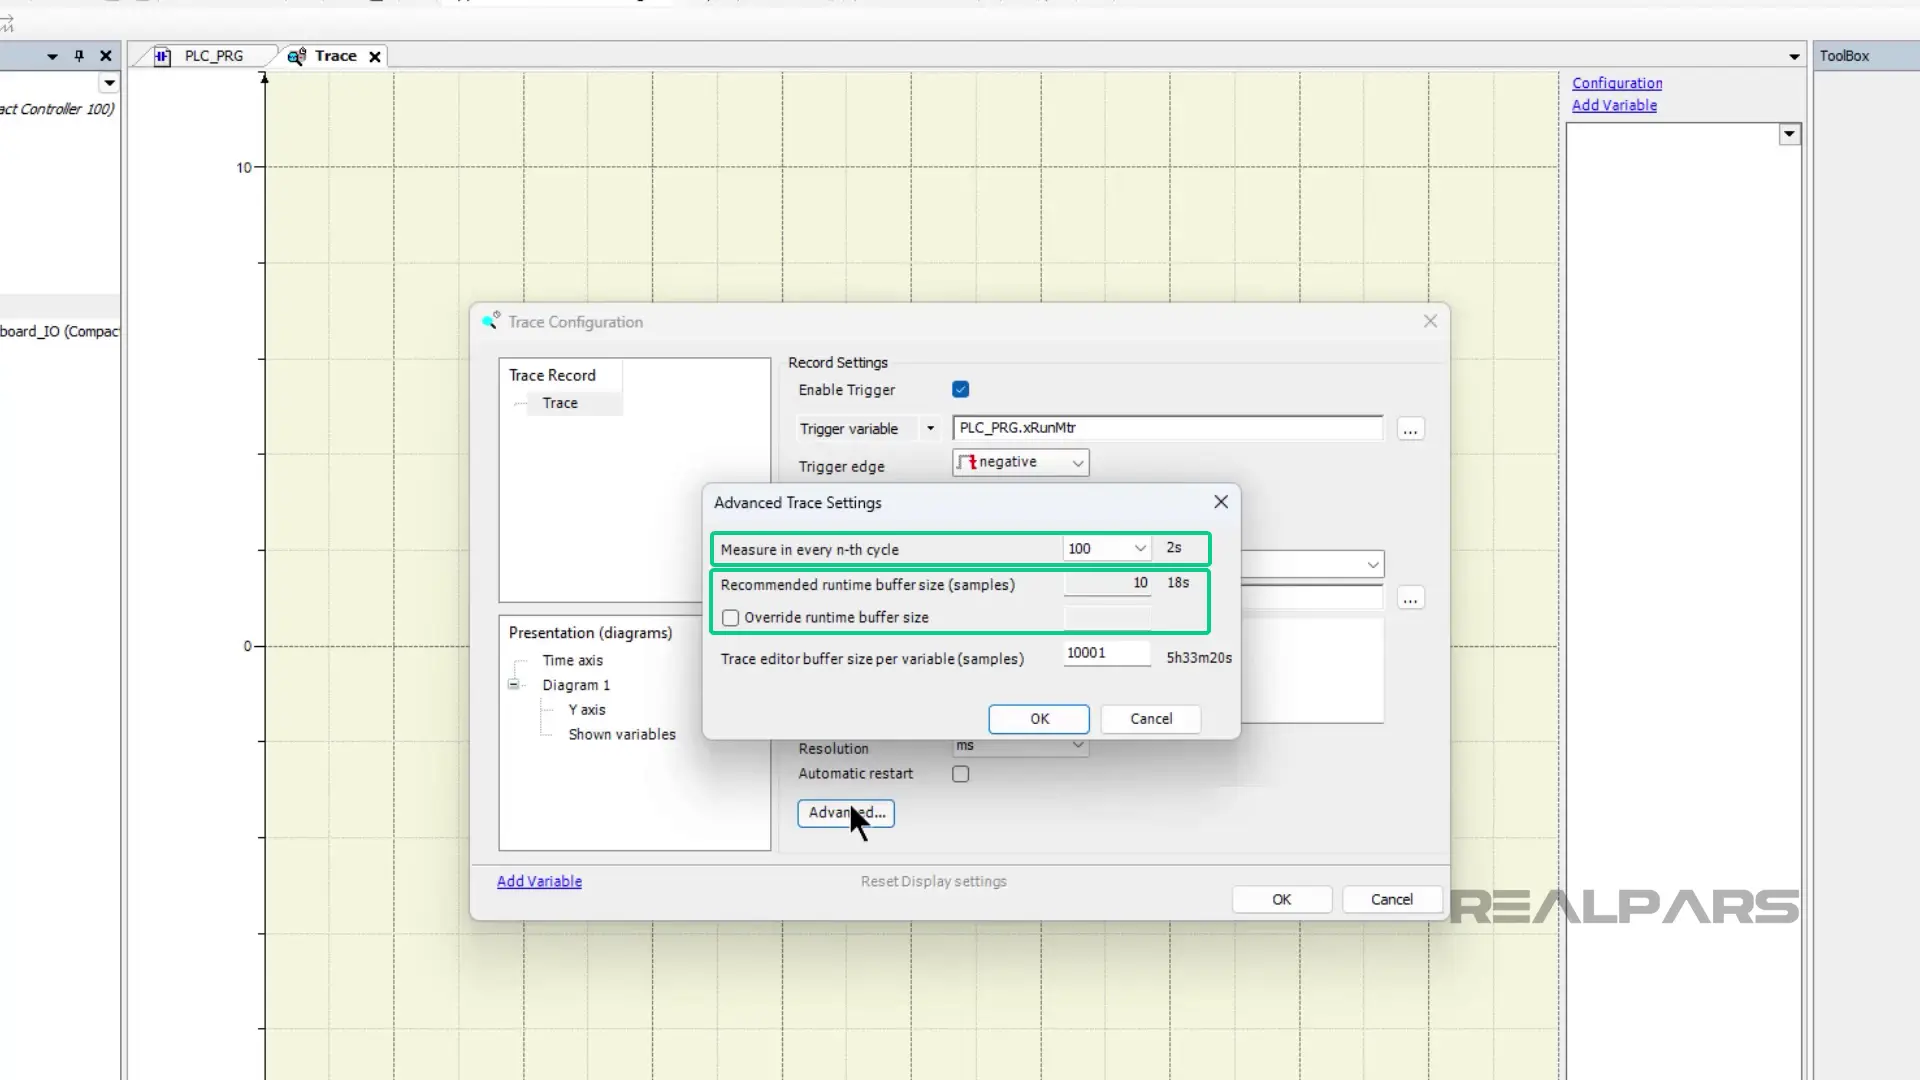
The way you configure these advanced settings will depend on how long you want to record data for and how accurately you want to record it.
Add a variable to a trace
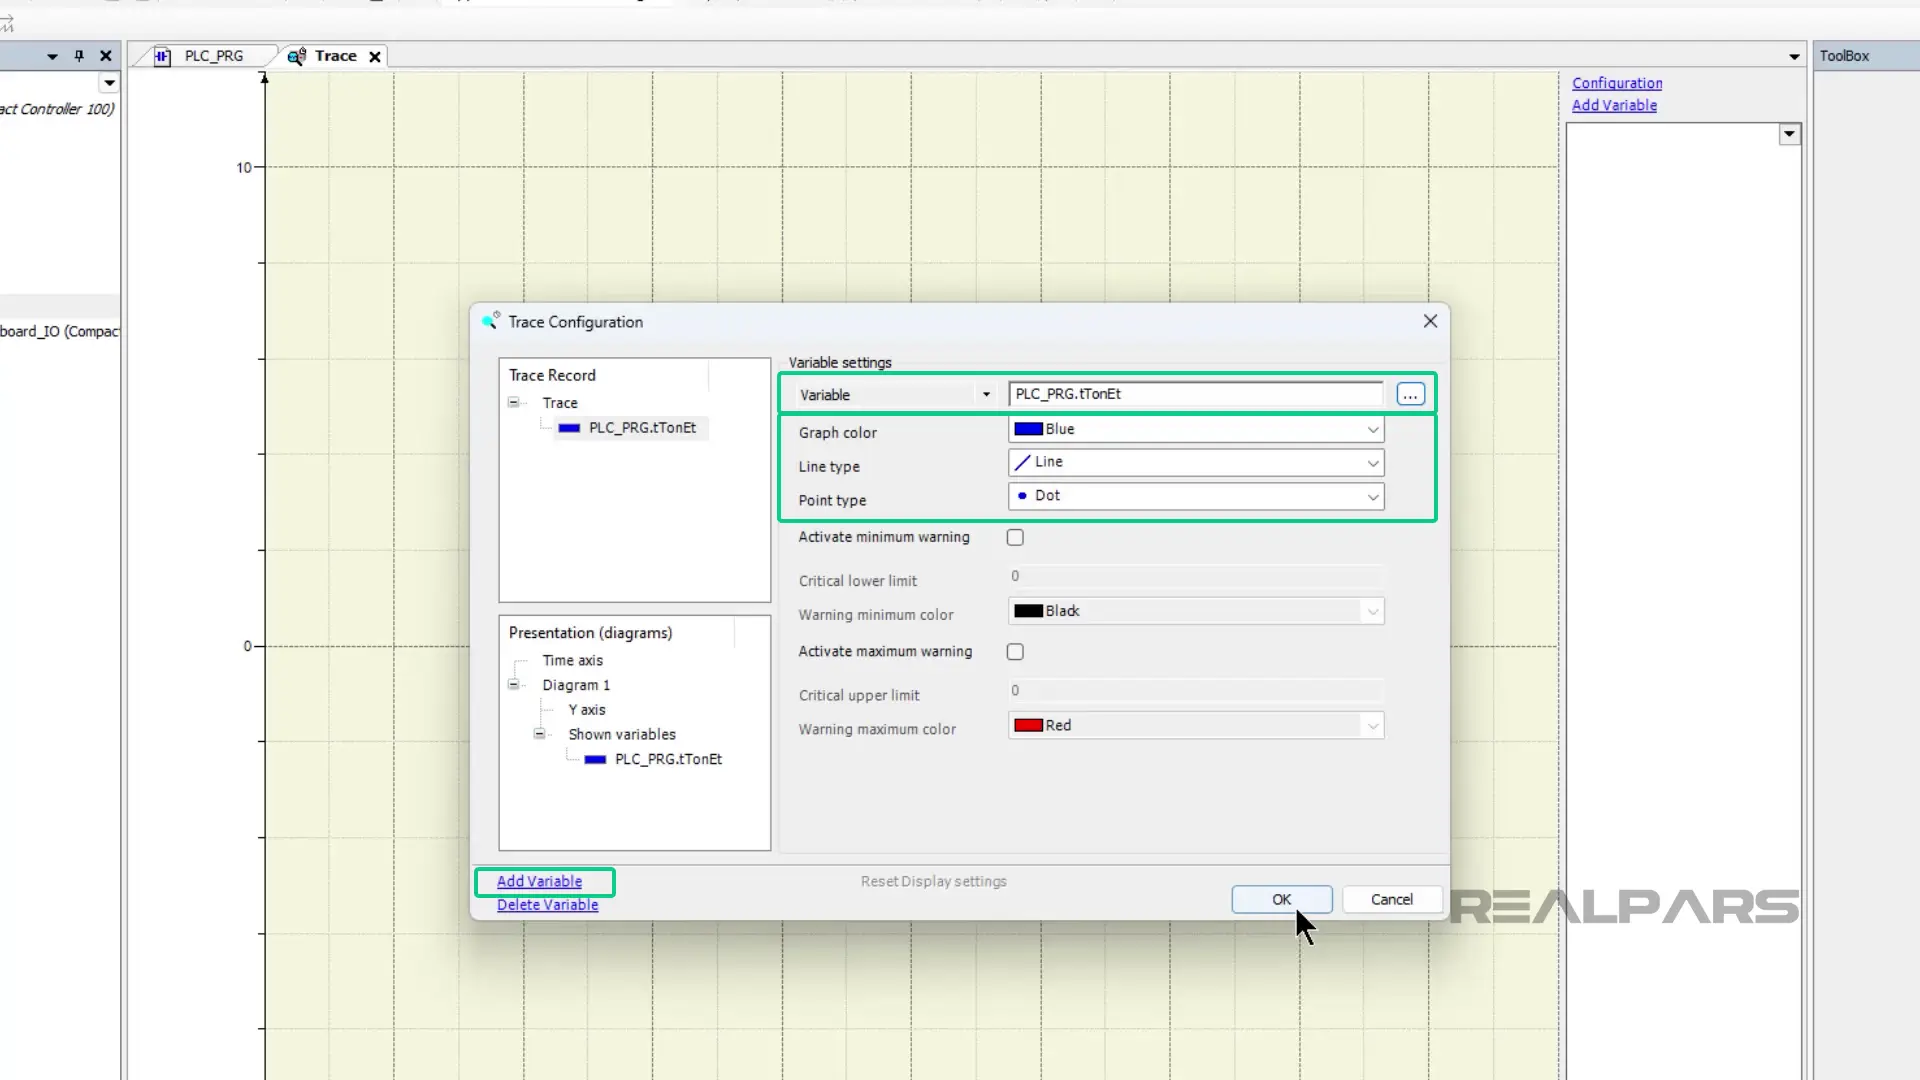
After configuring the trace, you can press the Add Variable button in the bottom left corner of the Trace Configuration dialog to add data to the trace.
After clicking the button, you can specify which variables you want to record in the trace and how the variable’s data will be visualized.
Here, I am recording the value of the variable tTonEt with a blue line and a dot to represent each sample.
I click OK to store the variable configuration.
Now that the trace has been fully configured, let’s download it to a PLC and see how it looks while running.
Monitor a trace
To download a trace to a running application, log in to the application, right-click on the Trace, and select Download Trace as shown here.
Once the trace has been downloaded, I modify the value of the variable xStartBtn to True and the trace starts collecting data.
When the value of xRunMtr becomes False, the trace trigger is activated so the trace collects the defined number of post-trigger samples and then halts.
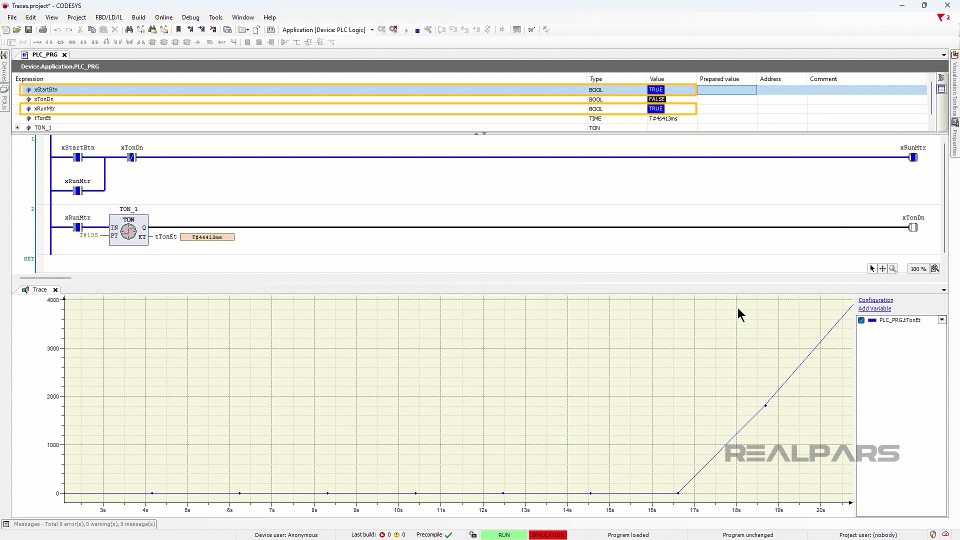
Using my mouse, I can zoom in and out on the trace’s data and pan left and right to see how the value of the traced variable changes over time.
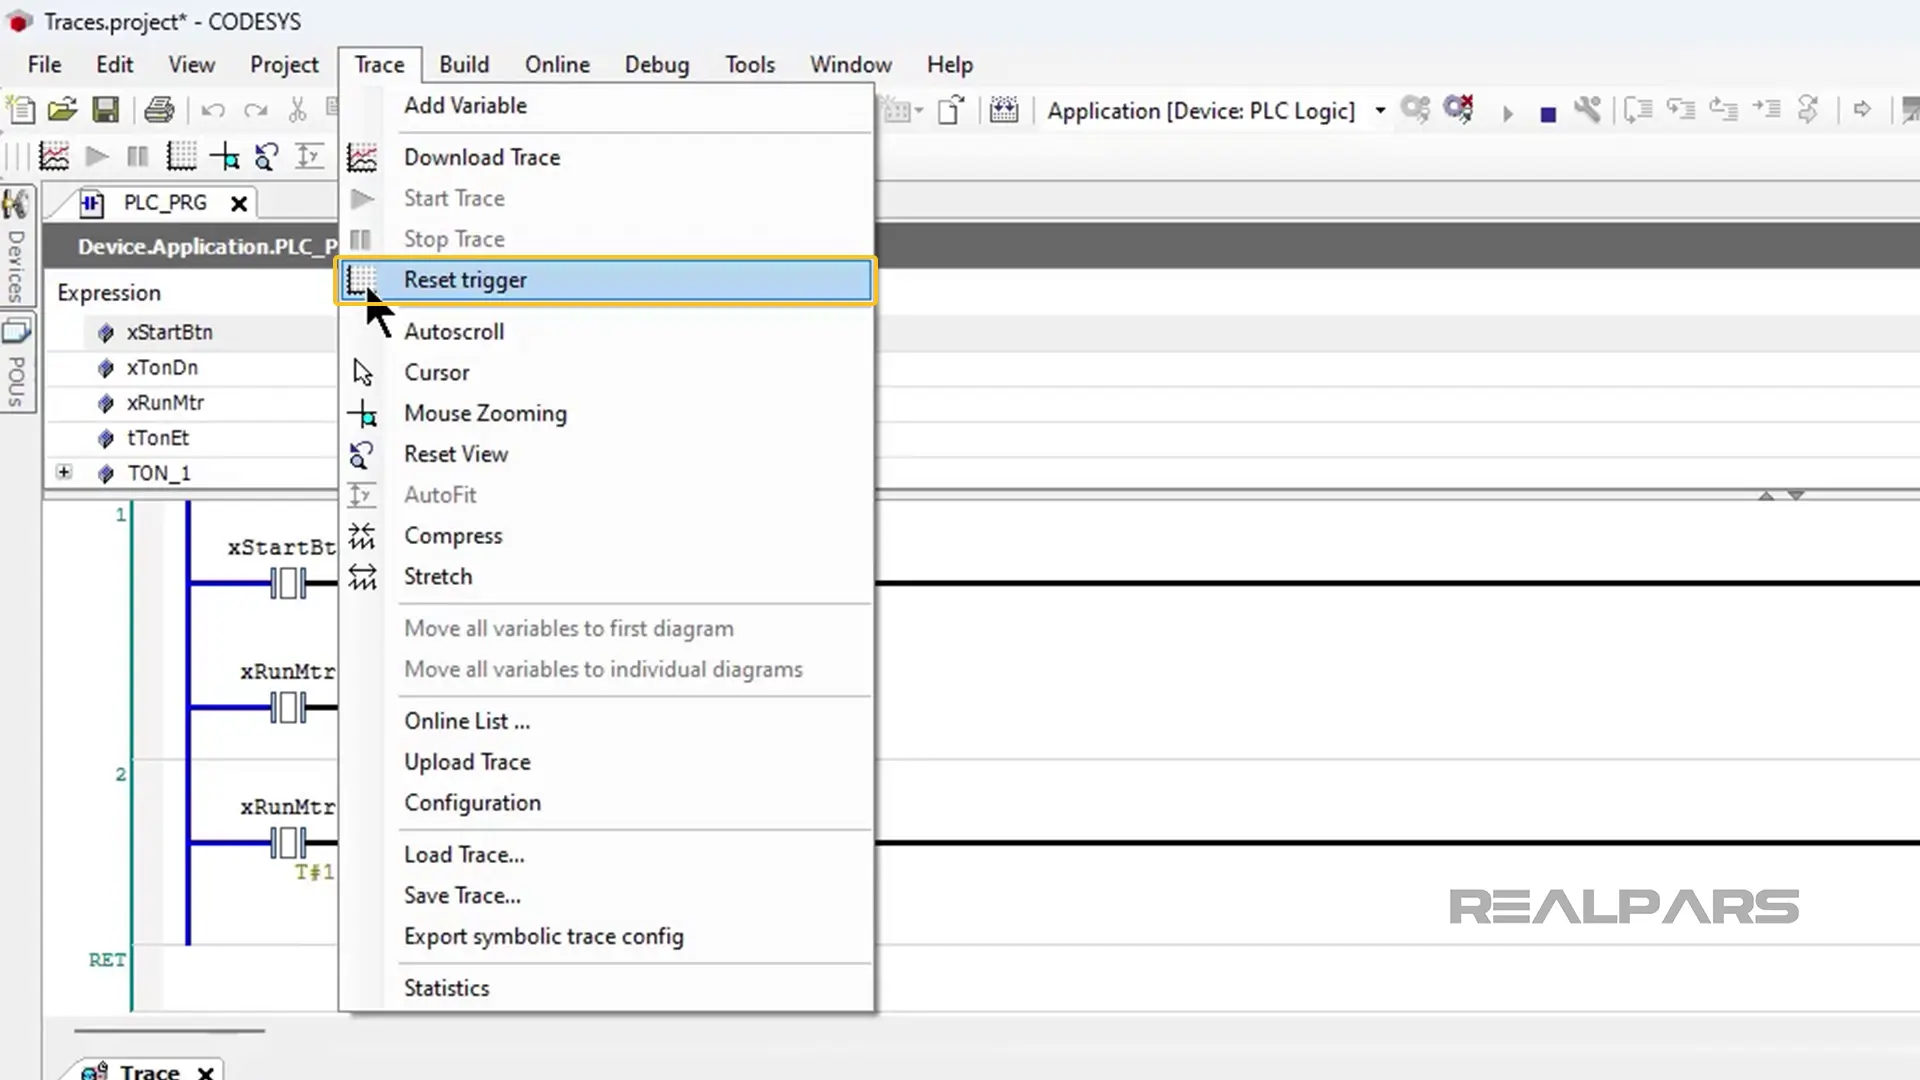
Once I have finished analyzing the trace’s data, I can reset the trace by clicking on Trace > Reset Trigger to start collecting data again.
Wrap-Up
In this article, you got a quick introduction to Trace in CODESYS. Traces are powerful debugging tools that every PLC programmer should leverage to verify timing diagrams, find intermittent problems, and analyze processes that can’t be stopped.
In this article, we barely scratched the surface of the power of Traces in CODESYS. You can also export trace data for analysis in different tools, configure traces to have multiple Y-Axes to scale different variables in different ways, and visualize traces directly in a CODESYS visualization.
Our course, CODESYS Debugging Techniques for Controls Engineers, is now available for all Pro members. Check it out and start learning!
If you are interested in becoming a RealPars member, check out this link to learn more about all of the great benefits that you get from a RealPars membership.
Do you use traces in your CODESYS applications? Let us know in the comments what you use them for.