Using CODESYS with HMI Interfaces

In my previous article, I explained the advantages of developing visualizations using CODESYS and what options are available for deploying CODESYS visualizations. If you missed that article, you can find it here.
In this article, I will show you how to use a visualization to interact with a CODESYS control application.
By the end of the article, you will know what basic elements are available to build a visualization in CODESYS and how those elements can be used to interact with a control application.
Let’s get started.
Introduction to the visualization
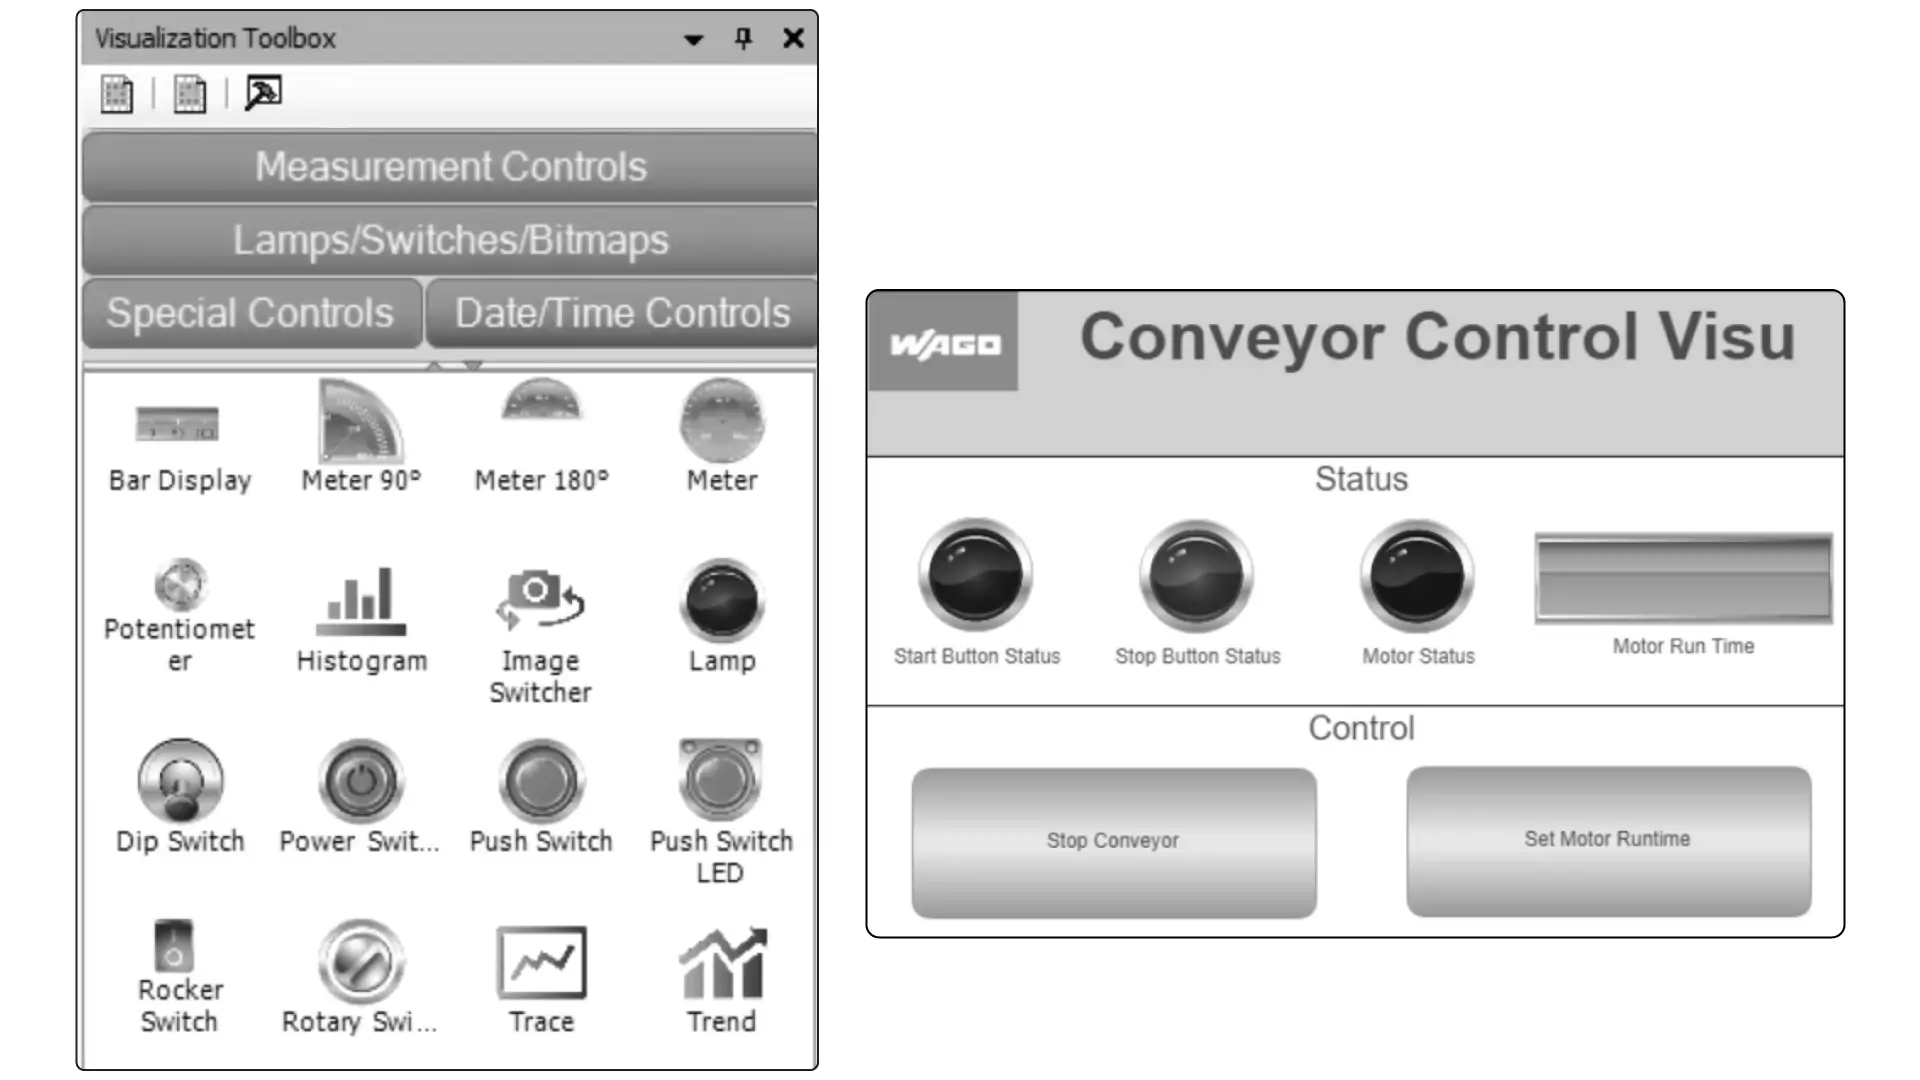
To demonstrate how to use HMI interfaces with CODESYS, I have created a sample control application and visualization in CODESYS.
If you would like to learn more about how to create control applications and visualizations in CODESYS, you can check out the RealPars courses CODESYS 1 Introduction to PLC Programming and CODESYS 2 Introduction to Visualization.
This visualization, like most CODESYS visualizations, is made up of a combination of static elements, status indicators, and controls.
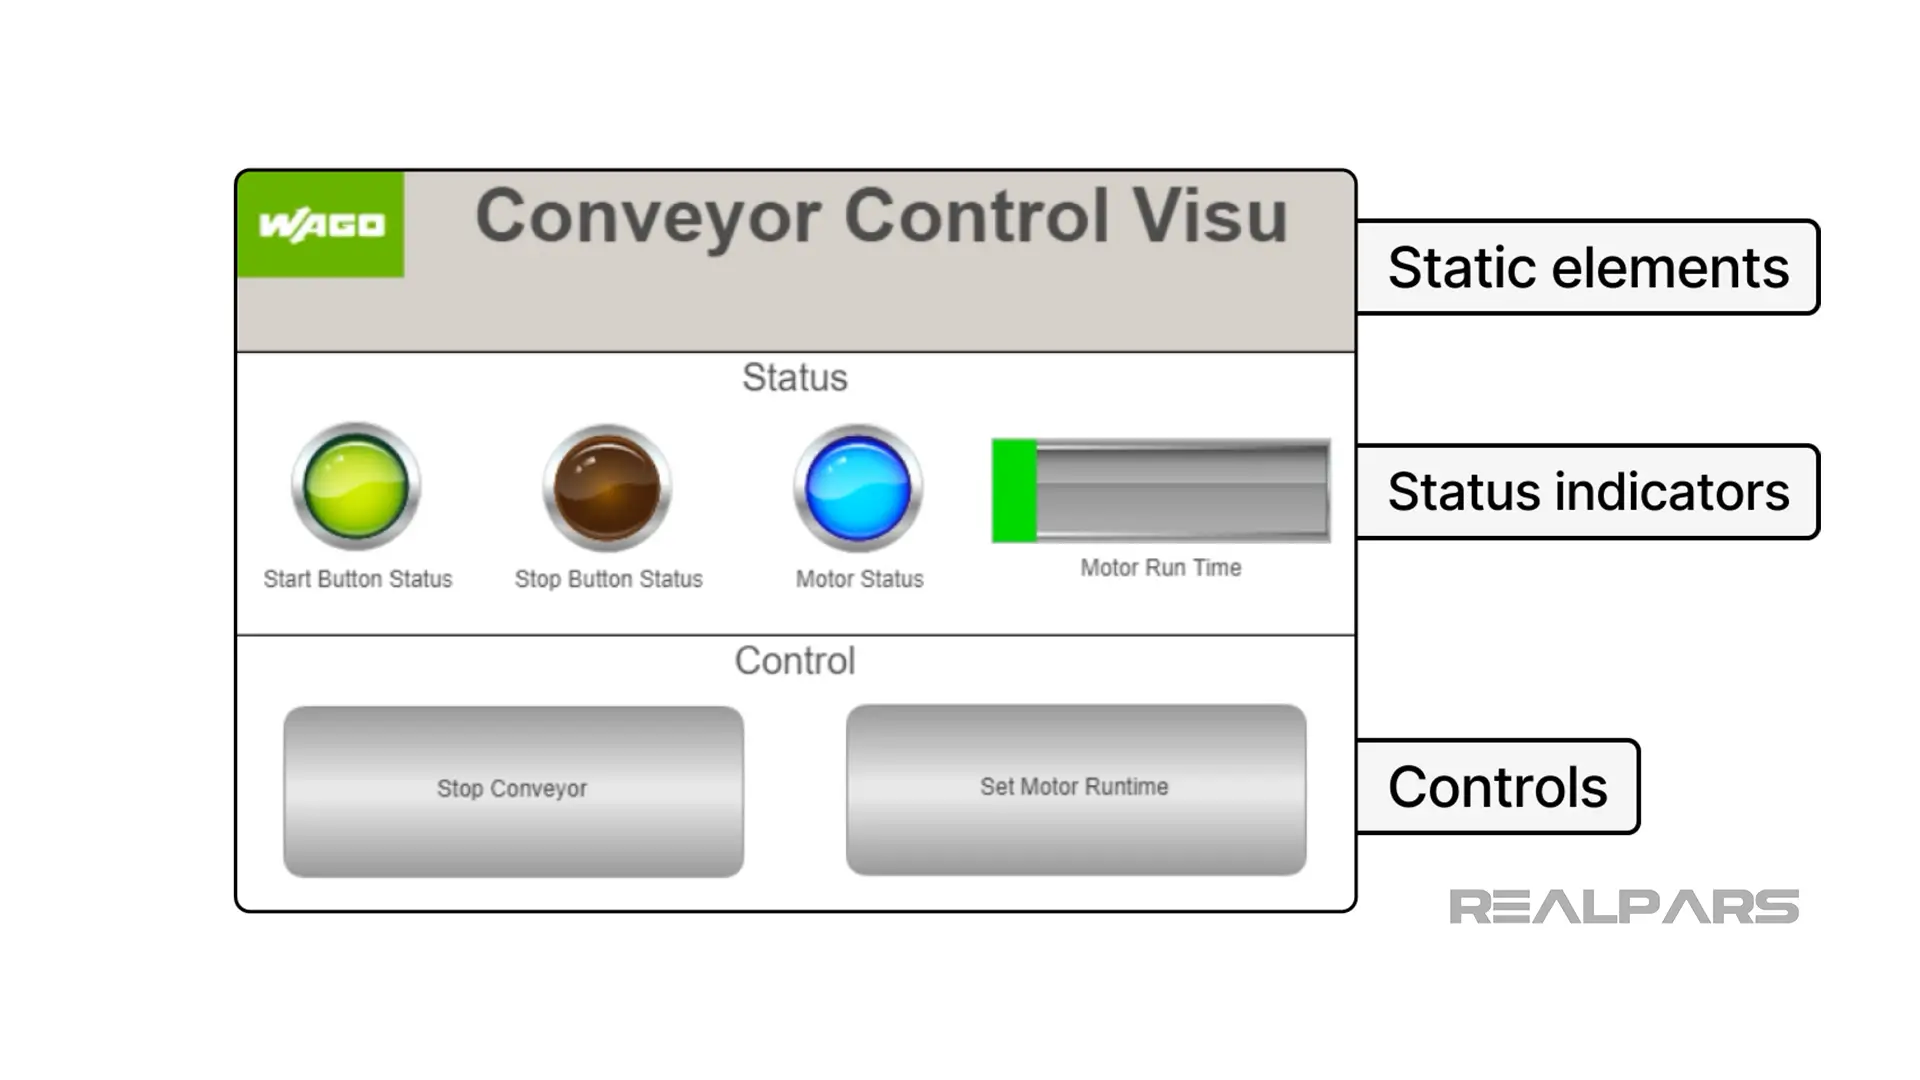
Let’s start by looking at the static elements in this visualization.
Static elements
Static elements are fixed elements that do not change while the visualization is running. These static elements provide the structure and branding for the visualization.
In this visualization, I have used Image elements to display a brand image to the operator, Rectangle elements to segment the display into a header, status area, and control area, and Labels to identify fixed areas in the display.
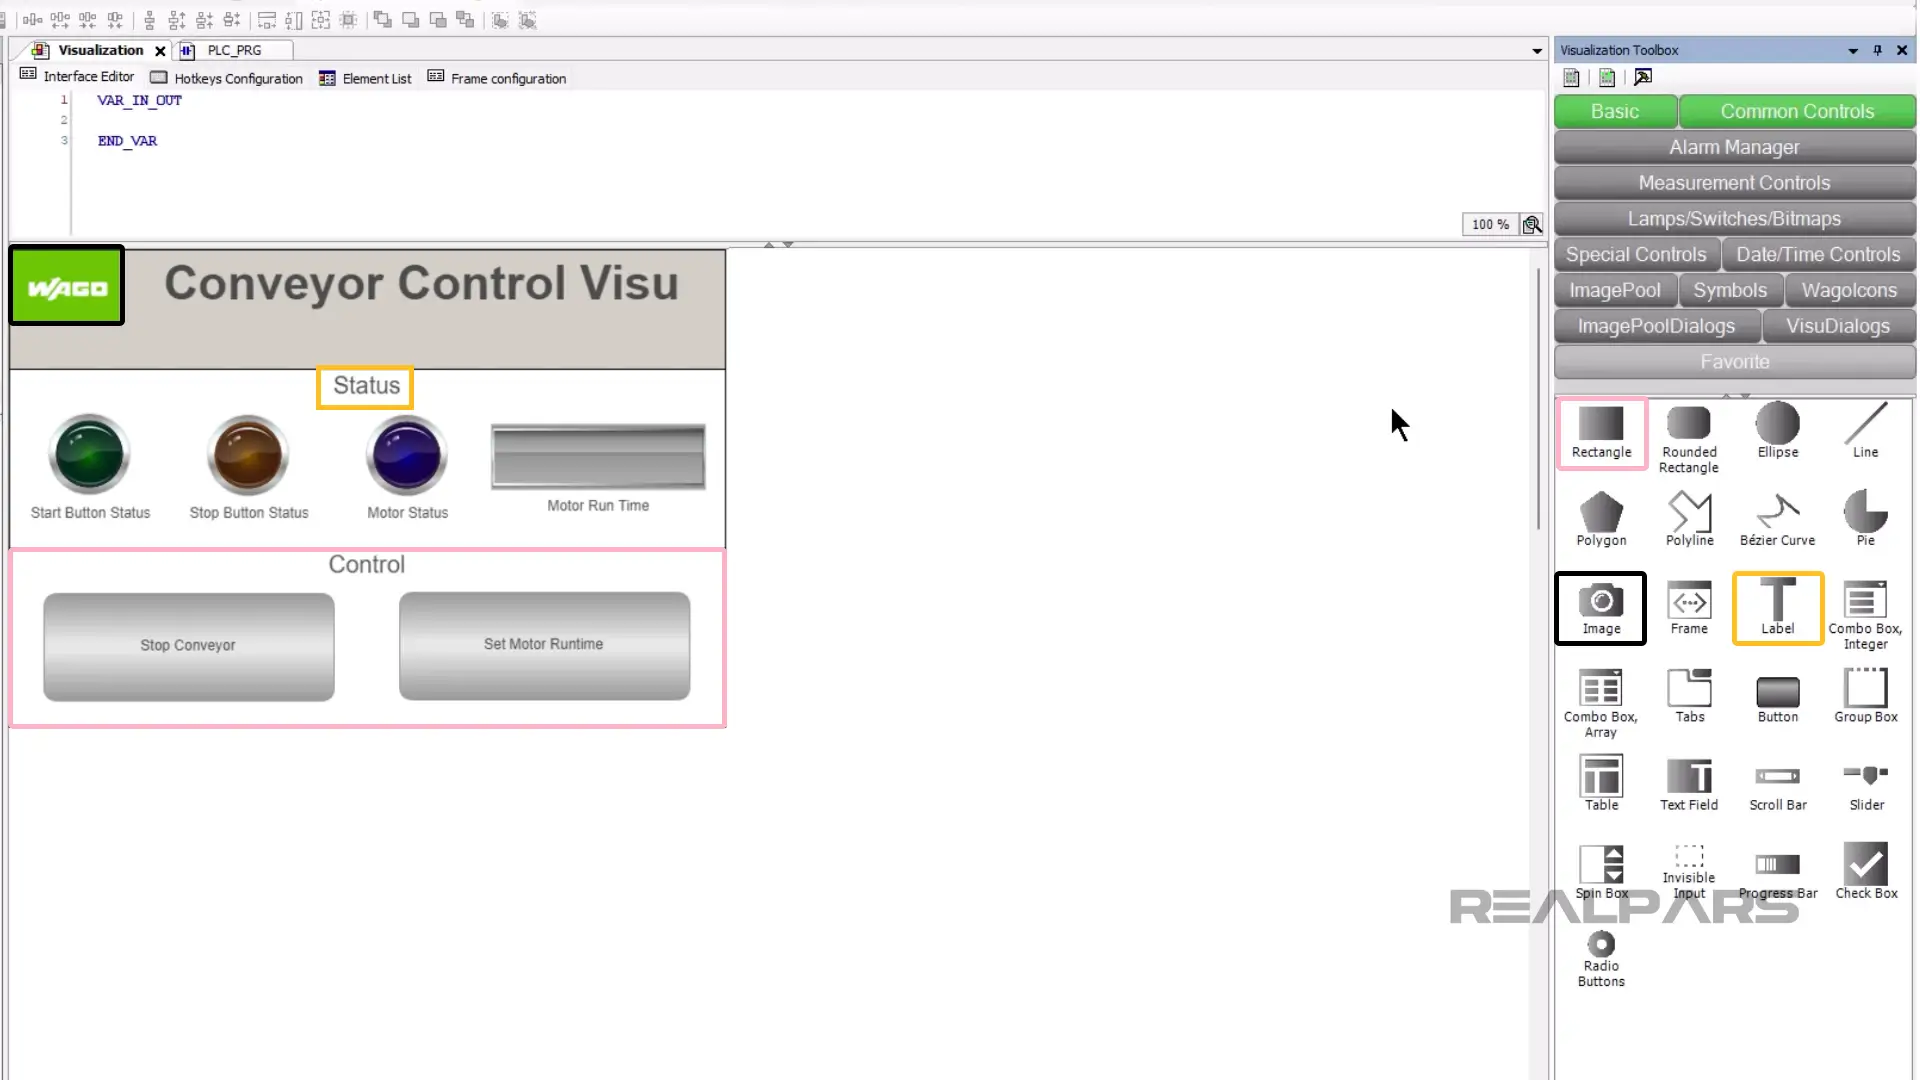
Other commonly used static elements that are available to use in a CODESYS visualization include lines, polygons, tabs, and group boxes.
Status indicators
Status indicators are dynamic elements. This means that their appearance can change based on the values of their associated variables while the visualization is running.
In this visualization, I have used two types of status indicators.
Lamps visualize the status of a Boolean variable by turning on and off when the variable becomes True and False.
Bar Displays fill and empty as the value of a variable changes. Bar displays are particularly useful for showing if the current value of a variable is within a normal range or if the value is reaching a critical threshold.
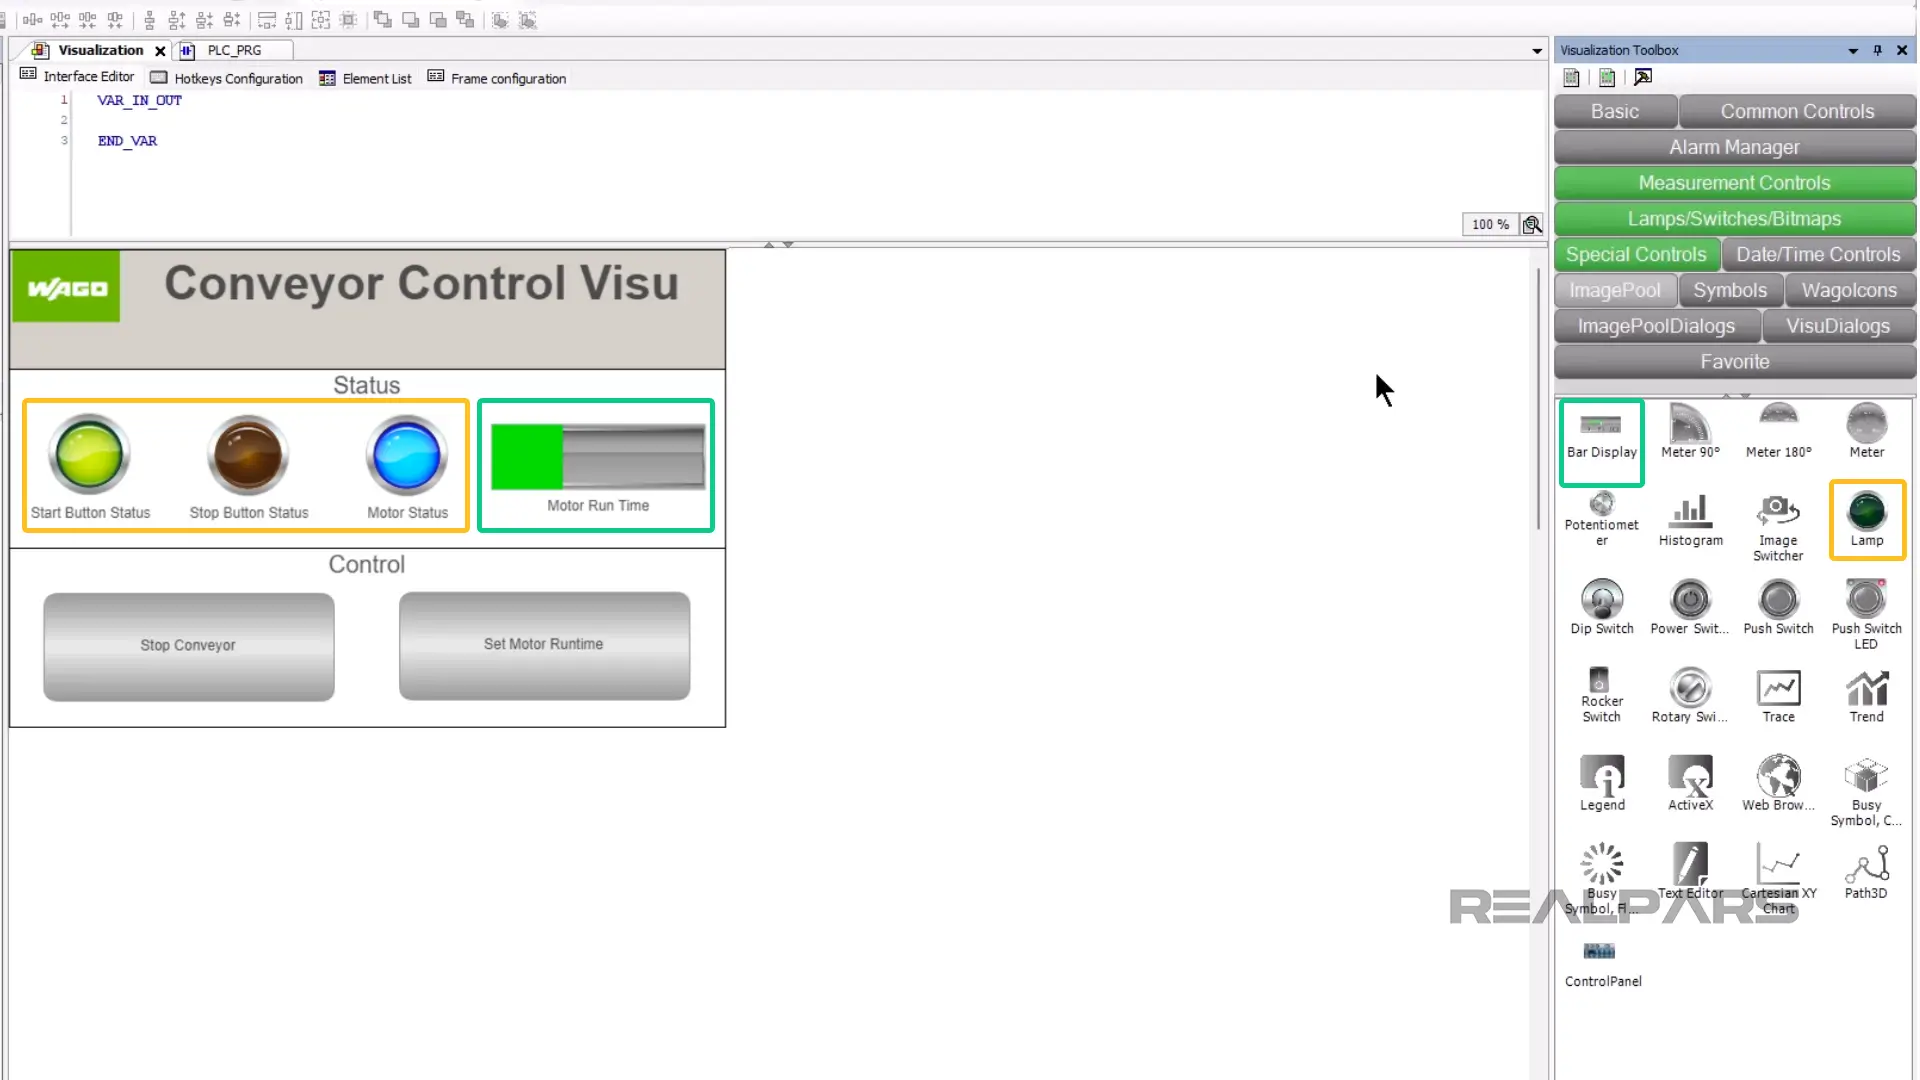
Some other common status indicators include traces, trends, and meters. All of these elements provide different ways to visualize the value of a variable at the current moment or over a period of time.
Controls
Finally, controls give an operator a way to modify the value of variables in a running control application.
CODESYS comes with many different controls but one of the most important controls is the Button which I have used twice in this visualization.
Buttons can be configured to execute a certain action when a certain event occurs.
In this visualization, the Stop Conveyor button writes the value True to a variable in the control application to stop running a motor when it is pressed. This is an example of using a button to write a fixed value to a variable.
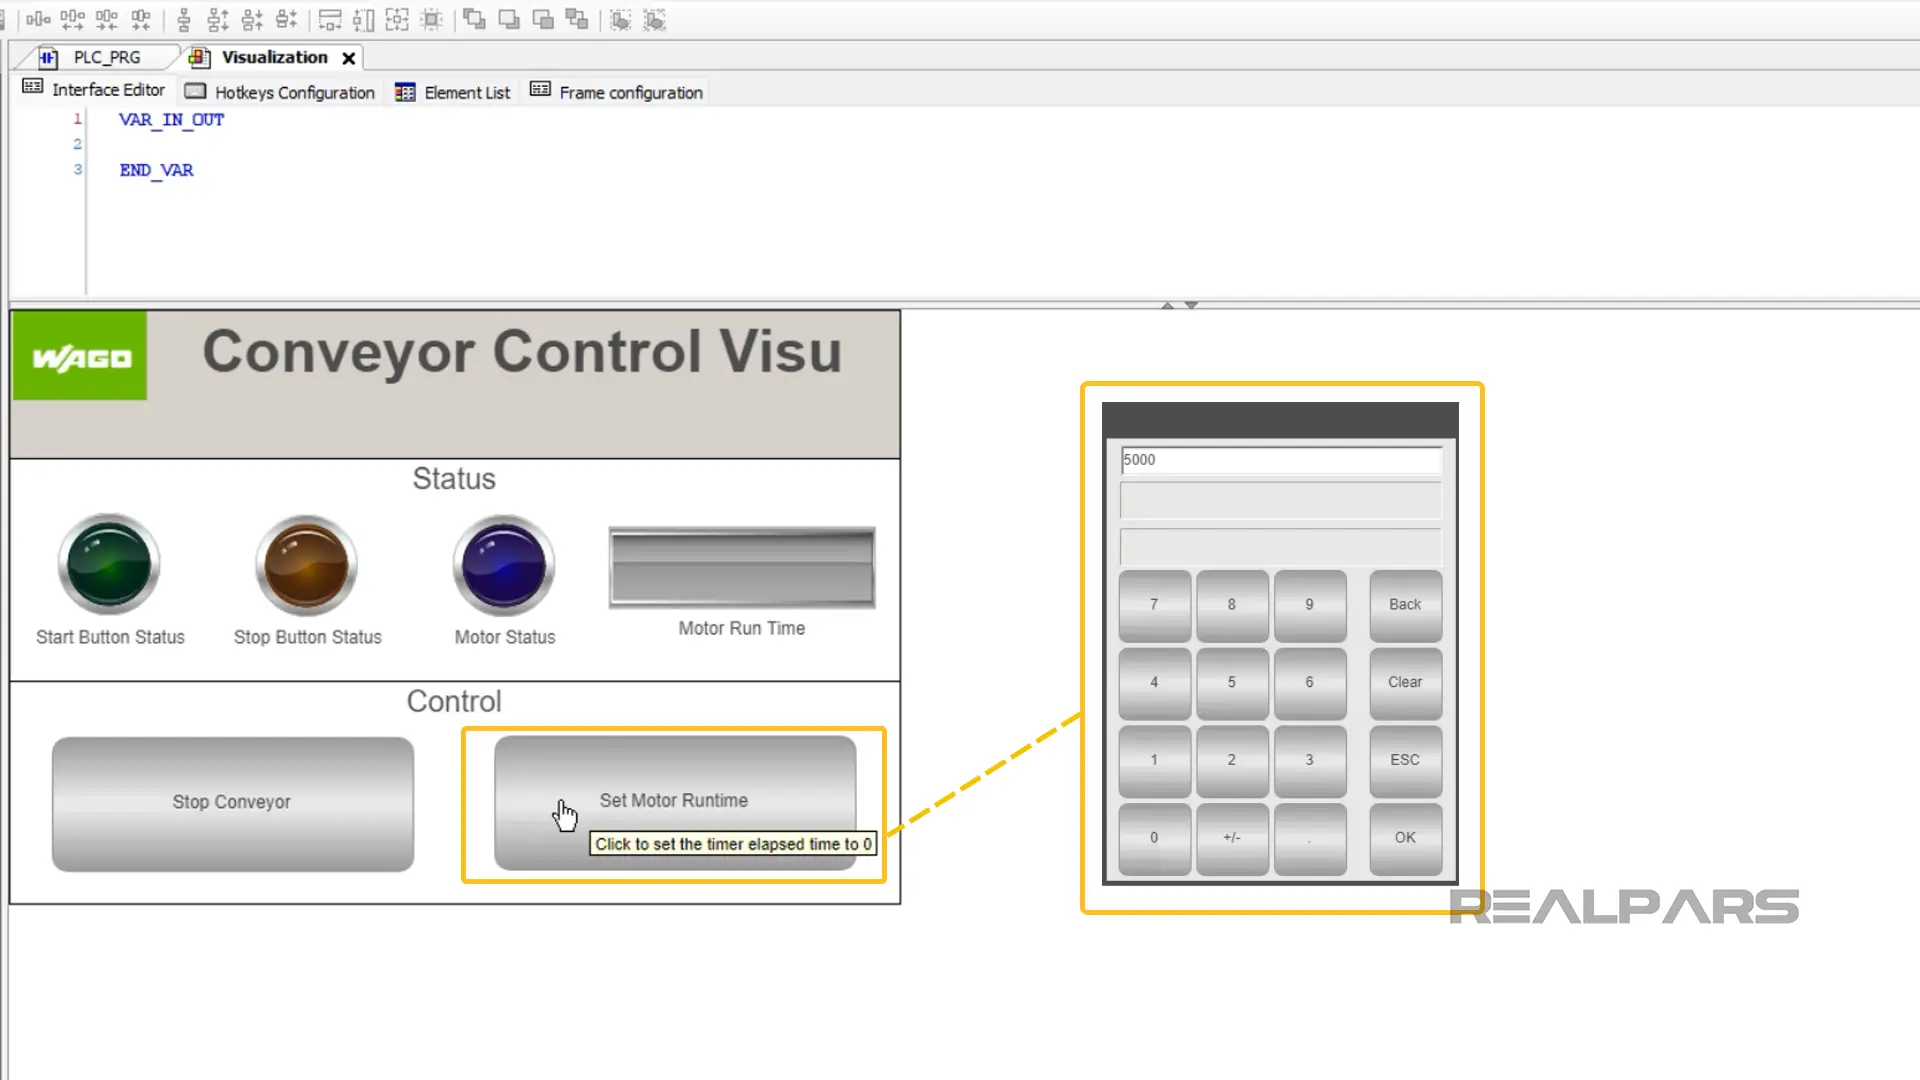
In contrast, the Set Motor Runtime button is configured to display a numeric input control when clicked.
The operator can use this numeric input to specify a value to write to a variable in the application. This is an example of using a button to write a variable value to a variable.
Some other common controls include radio buttons, text fields, sliders, and checkboxes. All of these elements provide an operator with a way to affect the value of a variable in the control application.

Wrap-Up
The CODESYS Development System provides many elements that can be used to quickly and easily create powerful visualizations for a control application.
Being able to develop visualizations is an essential skill for any PLC programmer since almost every control application has a dedicated visualization that tells an operator how the process is running and provides a way for the operator to interact with the application.
In this article, I have introduced you to some common static elements, status indicators, and controls that are used in visualizations to display and control the value of variables in a control application.
If you are interested in learning more about how to develop your own visualizations in CODESYS, then I highly recommend that you check out the RealPars course CODESYS 2 Introduction to Visualization.
In this course, I take you step-by-step through the process of developing a visualization in CODESYS while explaining how to use these common elements. I look forward to seeing you there.


Learn from Industry Experts
With a 7-day trial, then €25/month